
Spectromicroscopy, also referred to as spectra from images, provides the ability to generate quantitative XPS data from a series of images with the unique advantage that spectra may be generated from areas as small as a single pixel. This type of sample analysis is only possible due to the combination of high lateral imaging and very good energy resolution with the pulse counting, two-dimensional delay-line detector (DLD).
The spherical mirror analyser (SMA), shown in figure 1, has been employed on a commercially available photoelectron spectrometer for over ten years. During this time numerous examples of both elemental and chemical state images have been published and x-ray photoelectron imaging has become a routine technique for the determination of lateral distribution of elements and chemical species at the surface.
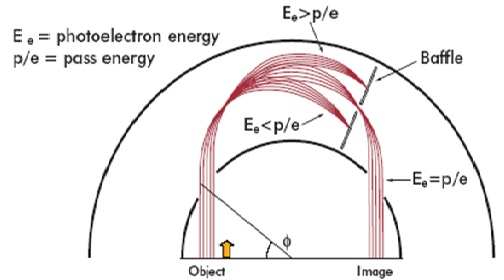
Figure 1 : The Kratos patented spherical mirror analyser.
Here we review the properties of the SMA including fast parallel image acquisition, high spatial and energy resolution and provide examples of the capabilities of such an imaging analyser. In the last three years the combination of the SMA with a two-dimensional, pulse counting electron detector has again increased the level of information available for surface characterisation. The delay-line detector (DLD) represents the next generation of photoelectron detection for XPS imaging and has allowed the realisation of quantitative surface chemical state microscopy by x-ray photoelectron spectroscopy. To generate such information requires the acquisition of multi-spectral datasets comprising a series of images incremented in energy so that each pixel contains photoelectron intensity as a function of energy, shown schematically in figure 2. The datasets generated by this method contain >65,500 spectra and are therefore ideally suited to multivariate analysis to analyse the information content of the dataset and as a tool for noise reduction in individual images or spectra. An example of a plasma modified and pattered polymer material is used to demonstrate parallel imaging using the SMA and the additional information that can be gained by using multivariate statistical analysis of multi-spectral datasets.
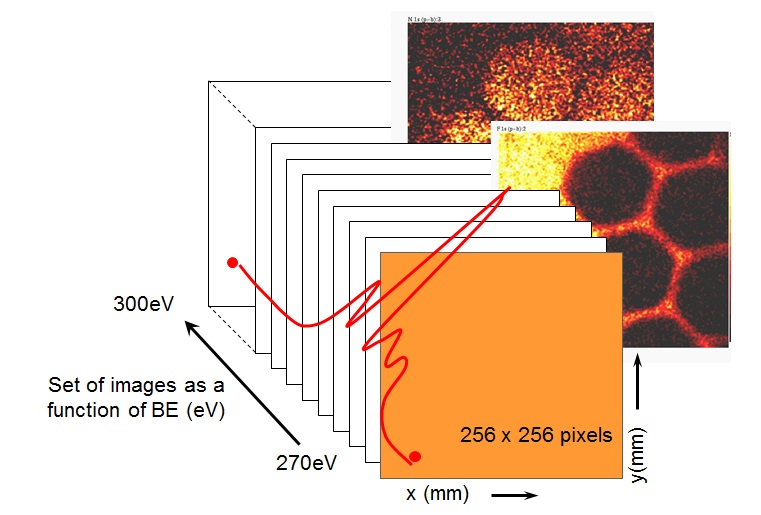
Figure 2 : A scematic diagram of the spectra from images experiment, generating a spectrum at each pixel.
Principle Component Analysis
Principle component analysis (PCA) assumes that any dataset can be described by a linear combination of one or more pure components. As described in the paper by Walton [1] multiplying the data matrix by its transpose, a covariance matrix is formed which can then be decomposed into an orthogonal dataset, using singular value decomposition (SVD) sort. From this the maximum variation in the data is partitioned into abstract components with the largest eigenvalues. The abstract factors without any obvious features can be attributed to noise. If the original dataset is reconstructed from only those abstract factors containing significant information, the result is a new dataset where the influence of the noise is reduced in magnitude. One limitation of the PCA approach to noise reduction is the significant computation time required although substantial decreases can be achieved by operating on a subset of each images at a time. In the example shown to the right the dataset of 256 images is processed in groups of 16 images such that the SVD is applied to adjacent images and then stepped through the dataset instead of being applied to the entire dataset at once. The result is to move the vector containing the most information to the top.
In this example the sample has been generated by exposing polystyrene substrate sample to a CFx plasma such that the sample becomes surface modified. A TEM grid was then placed on the surface and used to mask the subsequent exposure to an amine (C-O, C-N) containing plasma. Following the sample preparation a series of images were acquired over the C 1s envelope as shown in the schematic in Figure 2 with data acquisition taking 75 minutes. Post acquisition processing using the PCA methods outlined above were used to generate spectra of the series of images. This then allowed components to be fitted to the spectra corresponding to the carbon chemistry identified from a large area conventional spectrum acquired from the sample. Following the curve fits to each of the spectra from images the distribution of each chemical component can be recreated to form an image with relative concentration of the chemical state indicated by the pixel intensity (colour).
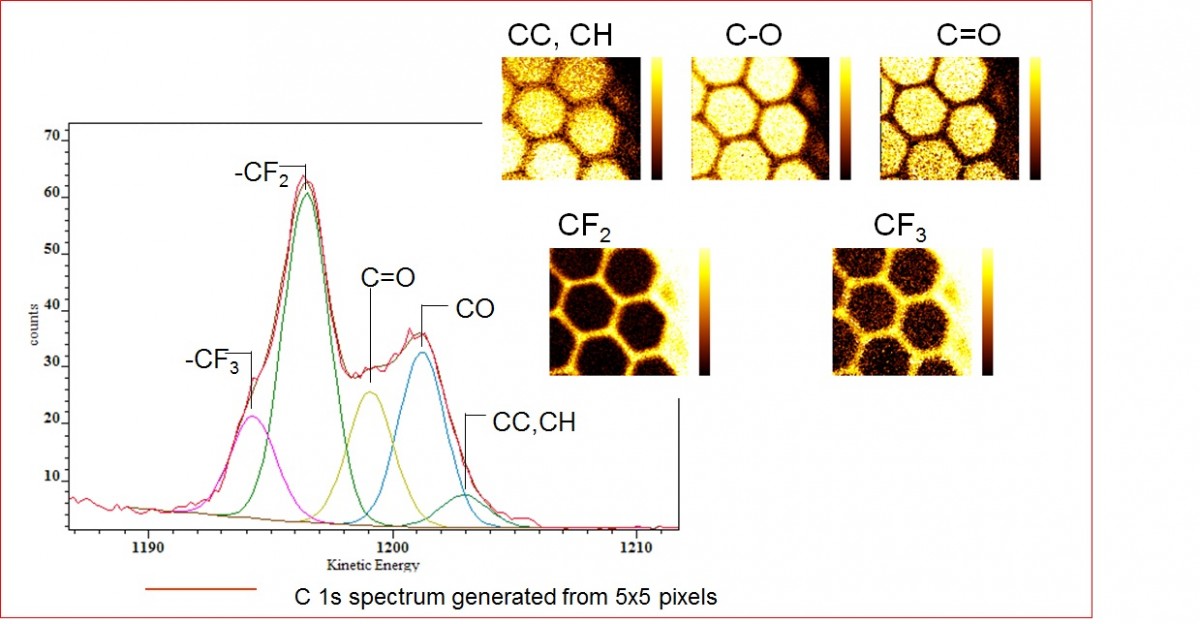
Figure 3 : Spectrum generated from a 5x5 pixel array with carbon components fitted under the C 1s envelope to represent the different chemical states. The insert shows the distribution of each component within the area imaged.
Summary
The SMA allows high energy and spatial resolution images to be acquired very rapidly. With the use of a pulse counting delay-line detector genuine quantitative images are acquired to characterise surface distribution of elemental or chemical state species. Acquiring a set of images incremented in energy over photoemission peaks a large 3-dimensional dataset can be generated easily. The use of multivariate statistical analysis to extract the information content of the multi-spectral dataset and as a tool for noise reduction in images or spectra has been demonstrated.
An A4 pdf version of the poster can be downloaded directly from the 'downloads' section of the Members Area or by contacting the Applications Specialists at Kratos Analytical Ltd, Manchester.
References
[1] Walton J, Fairley N. J. Electron Spec and Rel. Phenomena 148 (2005) 29-40
Acknowledgements
The application and development of SVD sort / PCA analysis for spectromicroscopy has been lead by Drs J. Walton and N. Fairley. Their help in data processing using CasaXPS is acknowledged.
Spectromicroscopy is explained further in a Spectroscopy Europe article written by John Walton which can be downloaded here.